State-Based Alerting: Understanding Why Kubernetes Deployments Fail
Application vs Infrastructure
Application and infrastucture normally have very different failure scenarios, Application errors are normally due to bugs (that produce exceptions) or performance related problems. When there are problems it becomes immiedatly obvious - page fails to load or starts timing out. Infrastructure health is more often related to configuration errors, drift, permissions and unhealthy dependencies problems can lay latent and be influenced by drift and dependences.
Common application health methodologies include USE (utilization, saturation,errors) and RED (rquests, errors, duration) that primarily use metrics (and log/trace derived metrics) that define thresholds for known health states. It is fairly straightforard to define healthy, unhealthy and warning states. These methodoligies struggle with unknown states i.e. we are not receiving any traffic so we don't if there are any errors. Synthetic testing helps to surface problems by creating artificial transactions
Metric (Thresholds and Anomalies)
State Based
Synthetic Testing
Infrastructure errors tend be more state oreinted
Alerting Types and Examples
There are various types of alerting methods, and choosing the right one can be challenging.
| Alerting Type | Example(s) | Use Cases |
|---|---|---|
| Metrics (Threshold) | - CPU > 90% for 5 minutes. - Available disk space < 10GB. | Best for USE (utilization, saturation,errors) and known errors. |
| Anomaly Detection | - Website traffic drops 50% compared to the same time last week. - Login attempts spike far beyond the normal range. | Useful for detecting unusual patterns and behavior that deviate from historical norms. Suitable for security monitoring and business metrics. |
| Log-Based | - More than 10 "HTTP 500" errors in web server logs within 1 minute. - Any log containing OutOfMemoryError. | Ideal for error detection, security events, and application-specific issues that are captured in logs. Good for detailed troubleshooting context. |
| State Based | - Kubernetes Node condition Ready = False for 10 minutes. - Pod status is CrashLoopBackOff. - Deployment condition Progressing = False with reason: ProgressDeadlineExceeded. | Suitable for infrastructure and platform monitoring where resources have defined states. Good for Kubernetes and cloud resource health monitoring. |
| Synthetic | - Simulated user login journey fails from an external testing location. - Critical API endpoint response time exceeds 2 seconds from an external check. - Website homepage fails to load correctly from an external probe. | Best for end-to-end monitoring and user experience validation. Ideal for critical business flows and external service dependency checks. |
This article compares Metric vs State Based alerts needed by platform teams managing infrastructure and deployments.
Traditional monitoring relies on metrics. Tools like Prometheus collect numerical data and trigger alerts when values cross thresholds. For example, a PodCrashLooping rule in Prometheus might fire when the container restart count increases.
State-based alerting takes a different approach. It monitors the actual state that objects report about themselves (in Kubernetes, this includes conditions and status fields), which often contain human-readable explanations. These states often follow RAG (Red-Amber-Green) patterns, making them intuitive to understand.
Metrics
Using the example of a crashing pod, kubelet does not expose a native metric for this purpose. You need to use kube-state-metrics, which exposes the number of container restarts under kube_pod_container_status_restarts_total. You can then write a Prometheus Rule (alert):
alert: KubernetesPodCrashLooping
expr: increase(kube_pod_container_status_restarts_total[1m]) > 3
for: 2m
labels:
  severity: warning
annotations:
  summary: Kubernetes pod crash looping (instance {{ $labels.instance }})
  description: "Pod {{ $labels.namespace }}/{{ $labels.pod }} is crash looping"
And would produce an alert similar to this:
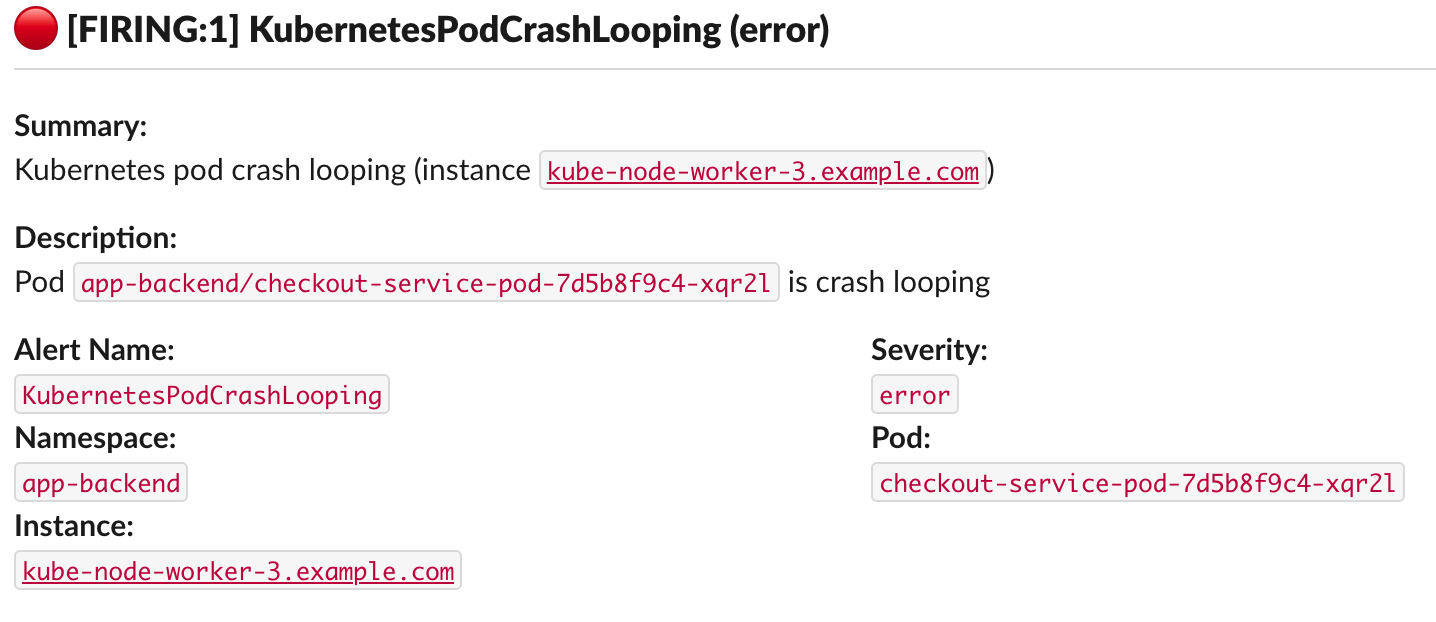
There are some drawbacks with this approach:
- Limited Details - The alert tells you what happened, but not why.
- Limited Context - You know the name of the pod and namespace, but not much else. If you want to restrict alerts to only pods labelled
env: production,kube-state-metricsneeds to be updated to whitelist the label. - Cardinality Challenges - Whitelisting is required, as without it, you risk a cardinality explosion. Ingesting large amounts of metrics can be expensive and inefficient.
- Configuration Overhead - Each failure scenario requires configuration, first with the extraction of metrics and then by creating and fine-tuning alerts.
These challenges are due to how TSDBs handle textual vs numerical data - the details and context you need is all in the text.
State-Based Alerting
The first step to "configuration-less" alerts is some standardization on what it means for something to be unhealthy. This is still an unsolved problem outside of Pod Probes. Kubernetes has taken some early steps with Conditions - which is an interface for reporting the state of a resource as either unhealthy or healthy.
If you run the following command to get the YAML definition of a Pod:
While standards exist for exposing metrics, there's no equivalent standard for exposing the thresholds or conditions that trigger alerts. This leads to fragmentation and complexity in monitoring setups.
is-healthy is a tool designed to assess and report the health status of Kubernetes and other cloud resources (such as AWS) without the limitations of metric-based approaches.
You can use is-healthy to check the status of a resource. For example, to check a pod and output the health status as JSON:
ready: false
health: unhealthy
status: ImagePullBackOff
message: Back-off pulling image "nginx:invalid"
lastUpdated: "2025-03-26T10:17:18Z"
This example output shows:
- ready: Whether the resource is reconciling or provisioning. Note:
readyindicates if the resource's desired state matches its actual state, which is different from its health. A pod in a failure state can bereadyif its state is stable (not changing). - health: One of
healthy,unhealthy,warning,unknown. This indicates the overall health assessment. - status: A text description of the state of the resource, for example,
RunningorImagePullBackOff. - message: A reason providing more detail for the current status.
- lastUpdated: The timestamp when the resource was lastUpdated or reconciled.
This is example isn't really thay useful, as it needs to be run continously, canary-checker is a kubernetes health-check platform with support for 30+ check types, The kubernetes check uses the is-healthy library:
This can be run locally:
Step-by-Step Guide to State-Based Alerting for Deployments
Understanding Deployment States
Kubernetes Deployments have a status field that contains critical information about rollout progress. Examine what a healthy Deployment status looks like.
Open your terminal and create a simple Nginx deployment, waiting for it to become ready:
deployment.apps/nginx created
Retrieve the status and it will look like this for a healthy object.
availableReplicas: 1
conditions:
- lastTransitionTime: "2025-03-26T10:11:23Z"
lastUpdateTime: "2025-03-26T10:11:23Z"
message: Deployment has minimum availability.
reason: MinimumReplicasAvailable
status: "True"
type: Available
- lastTransitionTime: "2025-03-26T10:11:18Z"
lastUpdateTime: "2025-03-26T10:11:23Z"
message: ReplicaSet "nginx-7584b6f84c" has successfully progressed.
reason: NewReplicaSetAvailable
status: "True"
type: Progressing
observedGeneration: 1
readyReplicas: 1
replicas: 1
updatedReplicas: 1
Simulating a failure:
deployment.apps/nginx image updated
And then checking on the status:
availableReplicas: 1
conditions:
- lastTransitionTime: "2025-03-26T10:11:23Z"
lastUpdateTime: "2025-03-26T10:11:23Z"
message: Deployment has minimum availability.
reason: MinimumReplicasAvailable
status: "True"
type: Available
- lastTransitionTime: "2025-03-26T10:11:18Z"
lastUpdateTime: "2025-03-26T10:17:16Z"
message: ReplicaSet "nginx-744c4cb859" is progressing.
reason: ReplicaSetUpdated
status: "True"
type: Progressing
observedGeneration: 2
readyReplicas: 1
replicas: 2
unavailableReplicas: 1
updatedReplicas: 1
Setting Up State-Based Alerting with Mission Control
Mission Control can monitor these states and alert when they indicate problems. Let's create a check to monitor deployment rollout status.
Create a new file named deployment-state-check.yaml:
apiVersion: canaries.flanksource.com/v1
kind: Canary
metadata:
  name: deployment-state-check
spec:
  interval: 30
  kubernetes:
    - name: check-deployment-rollout
      description: "Monitor deployment rollout state"
      resource:
        apiVersion: apps/v1
        kind: Deployment
        name: nginx-deployment
        namespace: default
      results:
      - name: Available
        selector: $.status.conditions[?(@.type=="Available")].status
        condition: Equal
        error: "False"
      - name: Progressing
        selector: $.status.conditions[?(@.type=="Progressing")].status
        condition: Equal
        error: "False"
      - name: ProgressingReason
        selector: $.status.conditions[?(@.type=="Progressing")].reason
        condition: Equal
        error: "ProgressDeadlineExceeded"
      - name: ErrorMessage
        selector: $.status.conditions[?(@.type=="Progressing")].message
        display: true
This Canary check:
- Runs every 30 seconds (
interval: 30). - Targets the
Deploymentnamednginx-deploymentin thedefaultnamespace. - Defines results based on JSONPath selectors applied to the Deployment's status:
- Checks if the
Availablecondition status isFalse. - Checks if the
Progressingcondition status isFalse. - Checks if the
Progressingcondition reason isProgressDeadlineExceeded. - Captures the
Progressingcondition message for display (display: true). An alert is triggered if any condition marked witherror:is met.
- Checks if the
Use kubectl to apply the Canary resource definition to your cluster:
kubectl apply -f deployment-state-check.yaml
This command registers your state-based check in Mission Control, which will now monitor your Deployment's state.
Simulating a Failed Deployment
Create a problematic Deployment to see state-based alerting in action.
Create a file named failing-deployment.yaml. This YAML defines a Deployment named failing-deployment:
apiVersion: apps/v1
kind: Deployment
metadata:
  name: failing-deployment
  namespace: default
spec:
  replicas: 3
  selector:
    matchLabels:
      app: failing-app
  strategy:
    rollingUpdate:
      maxSurge: 1
      maxUnavailable: 1
    type: RollingUpdate
  template:
    metadata:
      labels:
        app: failing-app
    spec:
      containers:
      - name: container
        image: nginx:latest
        resources:
          limits:
            memory: "10Mi"  # Intentionally too small
          requests:
            memory: "10Mi"
        ports:
        - containerPort: 80
This Deployment requests 3 replicas but sets a very low memory limit (10Mi), which is likely to cause Pods to be terminated with Out Of Memory (OOM) errors.
Use kubectl to apply the failing Deployment definition to your cluster:
kubectl apply -f failing-deployment.yaml
This command creates the Deployment, which will likely fail because the Pods require more memory than the specified limit.
Comparing Alerts: State-Based vs. Prometheus
Now, compare how different monitoring approaches handle this failure.
Prometheus Alert (Metric-Based)
With Prometheus, a common alert rule for deployment issues checks for generation mismatches:
  - alert: KubernetesDeploymentGenerationMismatch
    expr: kube_deployment_status_observed_generation != kube_deployment_metadata_generation
    for: 10m
    labels:
      severity: critical
    annotations:
      summary: Kubernetes Deployment generation mismatch (instance {{ $labels.instance }})
      description: "Deployment {{ $labels.namespace }}/{{ $labels.deployment }} has failed but has not been rolled back.\n  VALUE = {{ $value }}\n  LABELS = {{ $labels }}"
This alert fires when there is a mismatch between the observed and expected generation numbers of a Kubernetes Deployment. The generation number increments whenever the Deployment spec changes. A mismatch indicates that the latest configuration change has not been successfully rolled out by the controller. While useful, it doesn't explain why the rollout failed. See KubernetesDeploymentGenerationMismatch for more details on this type of alert.
Mission Control State-Based Alert
Use kubectl and jq to inspect the conditions within the status of the failing-deployment:
kubectl get deployment failing-deployment -o json | jq '.status.conditions'
The output might resemble the following:
[
  {
    "lastTransitionTime": "2023-06-15T15:10:23Z",
    "lastUpdateTime": "2023-06-15T15:10:23Z",
    "message": "Deployment does not have minimum availability.",
    "reason": "MinimumReplicasUnavailable",
    "status": "False",
    "type": "Available"
  },
  {
    "lastTransitionTime": "2023-06-15T15:15:45Z",
    "lastUpdateTime": "2023-06-15T15:15:45Z",
    "message": "ReplicaSet \"failing-deployment-75d55d96c\" has timed out progressing. 0/3 replicas available. Pods are being killed due to memory limit exceeded.",
    "reason": "ProgressDeadlineExceeded",
    "status": "False",
    "type": "Progressing"
  }
]
This output shows two conditions:
AvailableisFalsebecause the deployment does not have the minimum required replicas ready (MinimumReplicasUnavailable).ProgressingisFalsebecause the rollout timed out (ProgressDeadlineExceeded). The message provides specific details about the failure, potentially including reasons like OOM killing if the system surfaces that information here.
Mission Control captures this state and provides an alert with the error message from the Progressing condition (e.g., "ReplicaSet ... has timed out progressing..."). This points more directly to the root cause or the symptom reported by Kubernetes.
Common Pitfalls of State-Based Alerting
When State-Based Alerting Works Best (and When It Doesn't)
State-based alerting excels when:
- Resources self-report meaningful status
- Problems have descriptive error messages
- You need context for troubleshooting
It's less effective when:
- Resources don't update status fields
- You need to alert on trends over time
- Complex conditions require correlation between multiple resources
Avoiding Alert Storms
State changes can trigger multiple alerts. To avoid this:
- Group related states into single alerts
- Add debounce periods for flapping states
- Use a severity hierarchy based on states
Combining with Metric-Based Monitoring
The best approach is often a combination:
- Use state-based alerts for detailed diagnostics
- Use metric-based alerts for performance issues and trends
- Create correlation between the two for complete visibility
Conclusion
State-based alerting transforms monitoring from "something is wrong" to "this is why it's wrong." By capturing the actual state of resources rather than only metrics, Mission Control helps DevOps teams troubleshoot faster and understand failures better.
The ability to extract human-readable error messages directly from Kubernetes resources provides context that metrics alone cannot. As systems become more complex, this context becomes critical for effective incident management.
For Kubernetes operators, combining state-based alerting with traditional metrics creates a complete view of your system's health and gives you the power to resolve issues faster.
- [KubernetesDeploymentGenerationMismatch](https://samber.github.io/awesome-prometheus-alerts/rules#rule-kubernetes-1-24)